In this section, we will explore another way to view the concepts of ratio and proportion through the lens of rates. We can still see this application via a scaling-up and scaling-down process, but we will use the idea of units as a way to help students develop a gut feeling for the meaning of the scaling process. Bassok & Holyoak (1989) found that interdomain transfer of isomorphic topics between mathematics and physics seems to be better served when the concepts are developed broadly within the mathematics classroom. When these same concepts were addressed in narrow contexts, the physics students could not transfer the same concepts to the mathematics classroom. The implication here is that as teachers of mathematics, it is our responsibility to introduce mathematical concepts in a variety of contexts so that the transfer of the broader structure of the patterns can be recognized in other applied domains. For this reason, we will make a special effort to use applied situations to develop the mathematical principles we want to teach. Units and ties to real-world experiences are part of this development.
Subsection3.2.1Ratio and Proportional Reasoning: Roadkill Revisited
As we examine the concepts of ratio and proportion from a rates perspective, let’s recall our earlier, Activity 1.2.1, from Section 1.2. You can refresh your memory of this activity by watching the video in Figure 1.2.5.
In this activity, students frequently use rates as a means for solving the problem and determining how many seconds the Rover must run to reach the desired distance where the deer is placed. While some students will stick to more conventional rate units like cm/sec, others interpret the rate from an inverse point of view, sec/cm since they wish to have a model where they input a desired distance to obtain the time (in seconds) that they can use to tell the Rover how long it should move forward. The use of sec/cm as a rate of change is also an important deviation from the rate of change that is typically used, cm/sec, where the unit in the denominator is time. Lapp & Cyrus (2000) suggest it is also important for students to experience rates of change that are not time-based in order to abstract beyond physical motion involving velocity or acceleration. For example, in our daily lives we experience rates like that of fuel efficiency miles/gallon. When we measure energy density for the food we eat, we often use Calories/gram. In the next subsection, we will explore other non-time-based rates as a means to illustrate the concept of ratio as a relationship between quantities, but for now, let’s explore the units from Activity 1.2.1 and their connection to our discussion in Section 3.1.
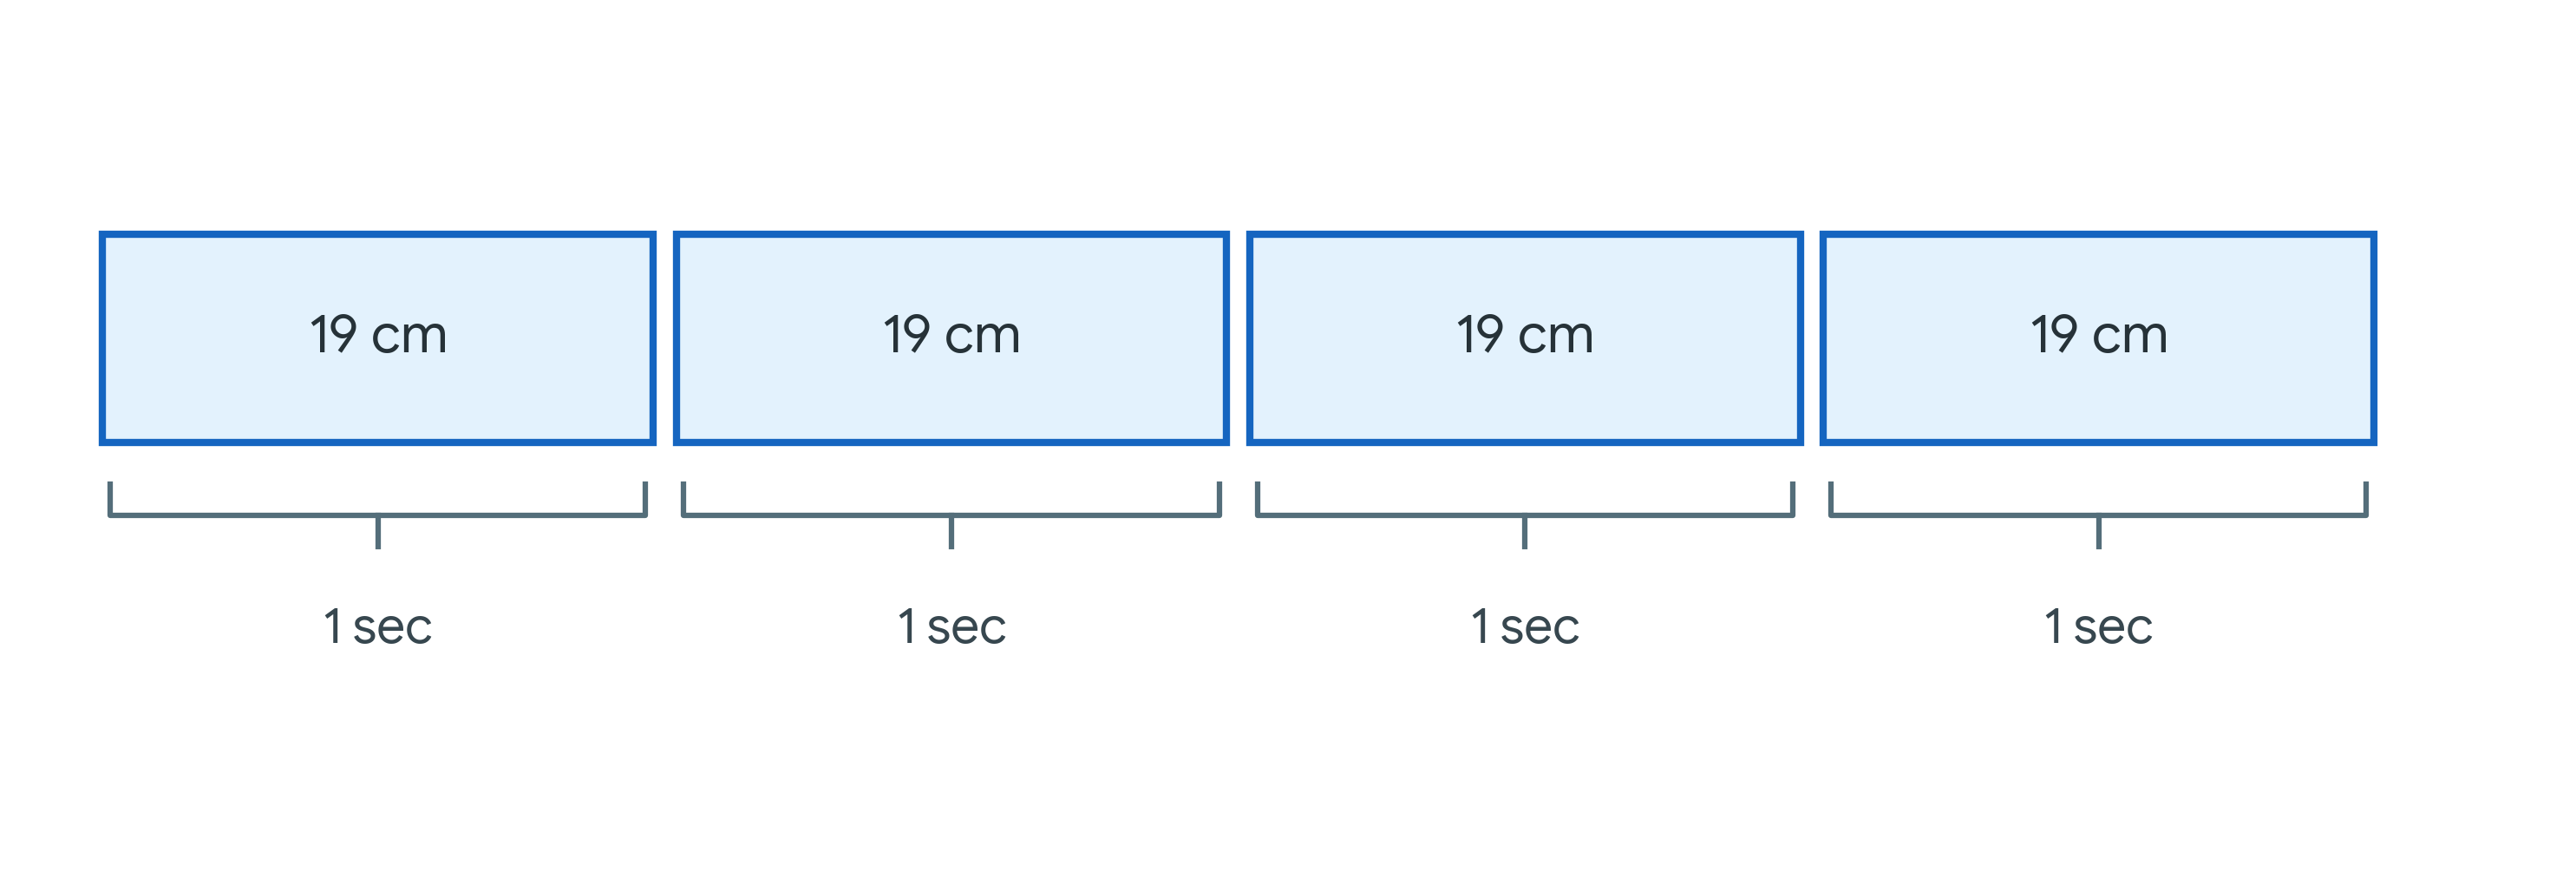
Suppose we consider a scenario where the deer is placed at the location 78 cm along the measuring tape. A common strategy students use in Roadkill is to start with a time of 1 second and see how far the Rover goes. A typical distance found is roughly 19 cm. If we want the Rover to stop just short of the deer, we could view the units of 19 cm/sec as saying we can scale up the a single rectangle/bracket image (see Figure 3.2.1) to 4 such images since \(19 \cdot 4=76\text{.}\)
The use of either cm/sec or sec/cm in the Roadkill activity can be visualized from the scale-up or scale-down perspective in Figure 3.2.1. In this representation, the units cm/sec or sec/cm depend on which part of the image you focus on first. If our eyes are drawn to the 19 cm labeled in the boxes first, we might interpret this as saying every 19 cm chunk takes 1 second to attain. If our eyes are first drawn to the 1 second brackets below, we might interpret this diagram as saying that for each second of movement, we obtain 19 cm of diatance.
Figure3.2.1.Visual Distance and Time Representation (cm/sec focus)
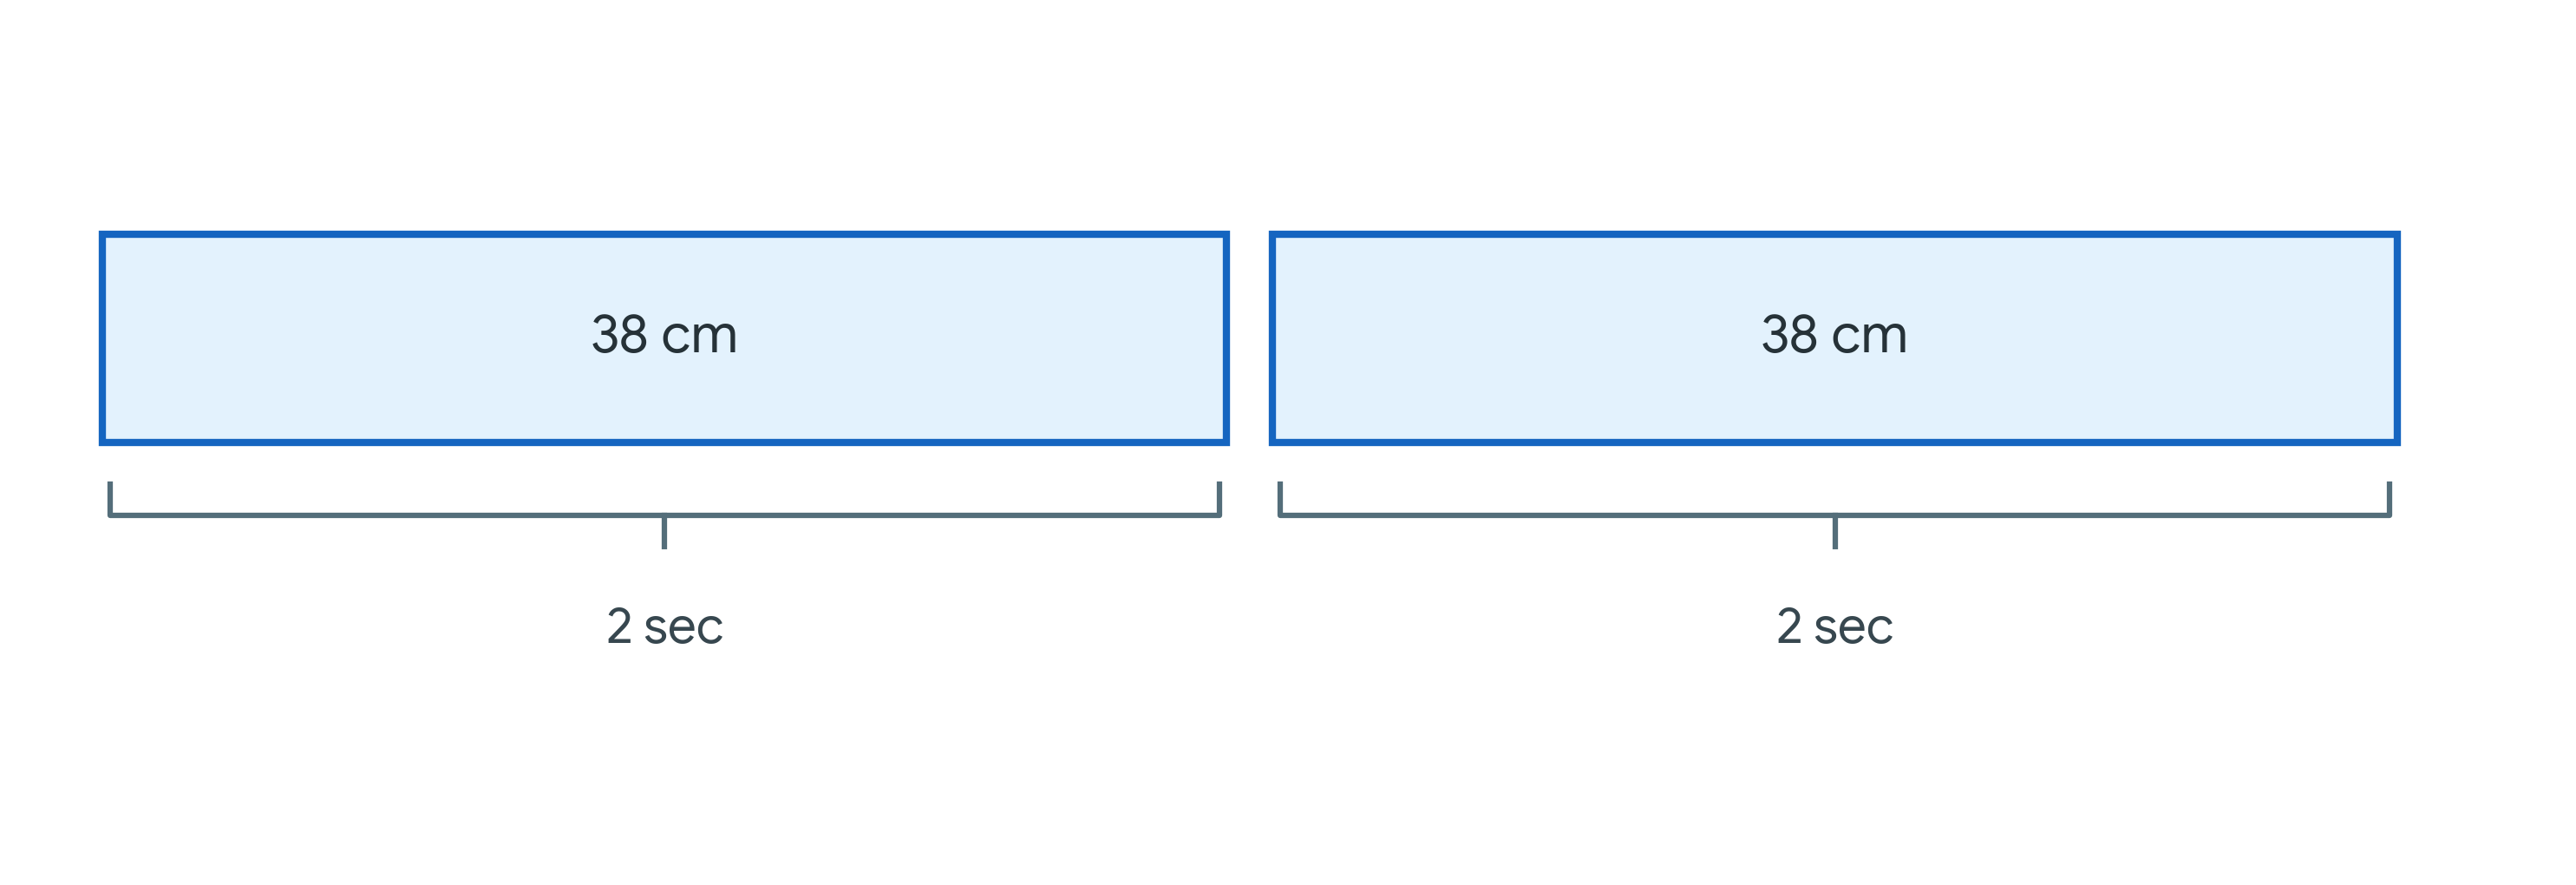
Further extending the scale-up/scale-down interpretation to rates, suppose students, while exploring the Roadkill task, started by entering 2 seconds with the Rover going 38 cm. The same visual representation might contain 2 chunks rather than 4 and be broken into 2 second intervals as seen in Figure 3.2.2. Now we have \(38 \cdot 2=76\) and thus we could interpret the rate as \(38 cm/2sec\) or, as a fraction, \(\frac{38}{2}\text{.}\) There is nothing wrong with expressing the rate in this form; however, it is uncommon for a student in a mathematics class to be allowed to leave it unsimplified. As teachers, it is important to realize that if the student experienced the rate by entering 2 seconds into the Rover, expressing the rate as \(\frac{38}{2}\) might actually carry more meaning \(-\) especially during the initial development of the concept. So adhering to convention during the learning process could be counterproductive to concept development.
Figure3.2.2.Visual Distance and Time Representation (cm/2sec focus)
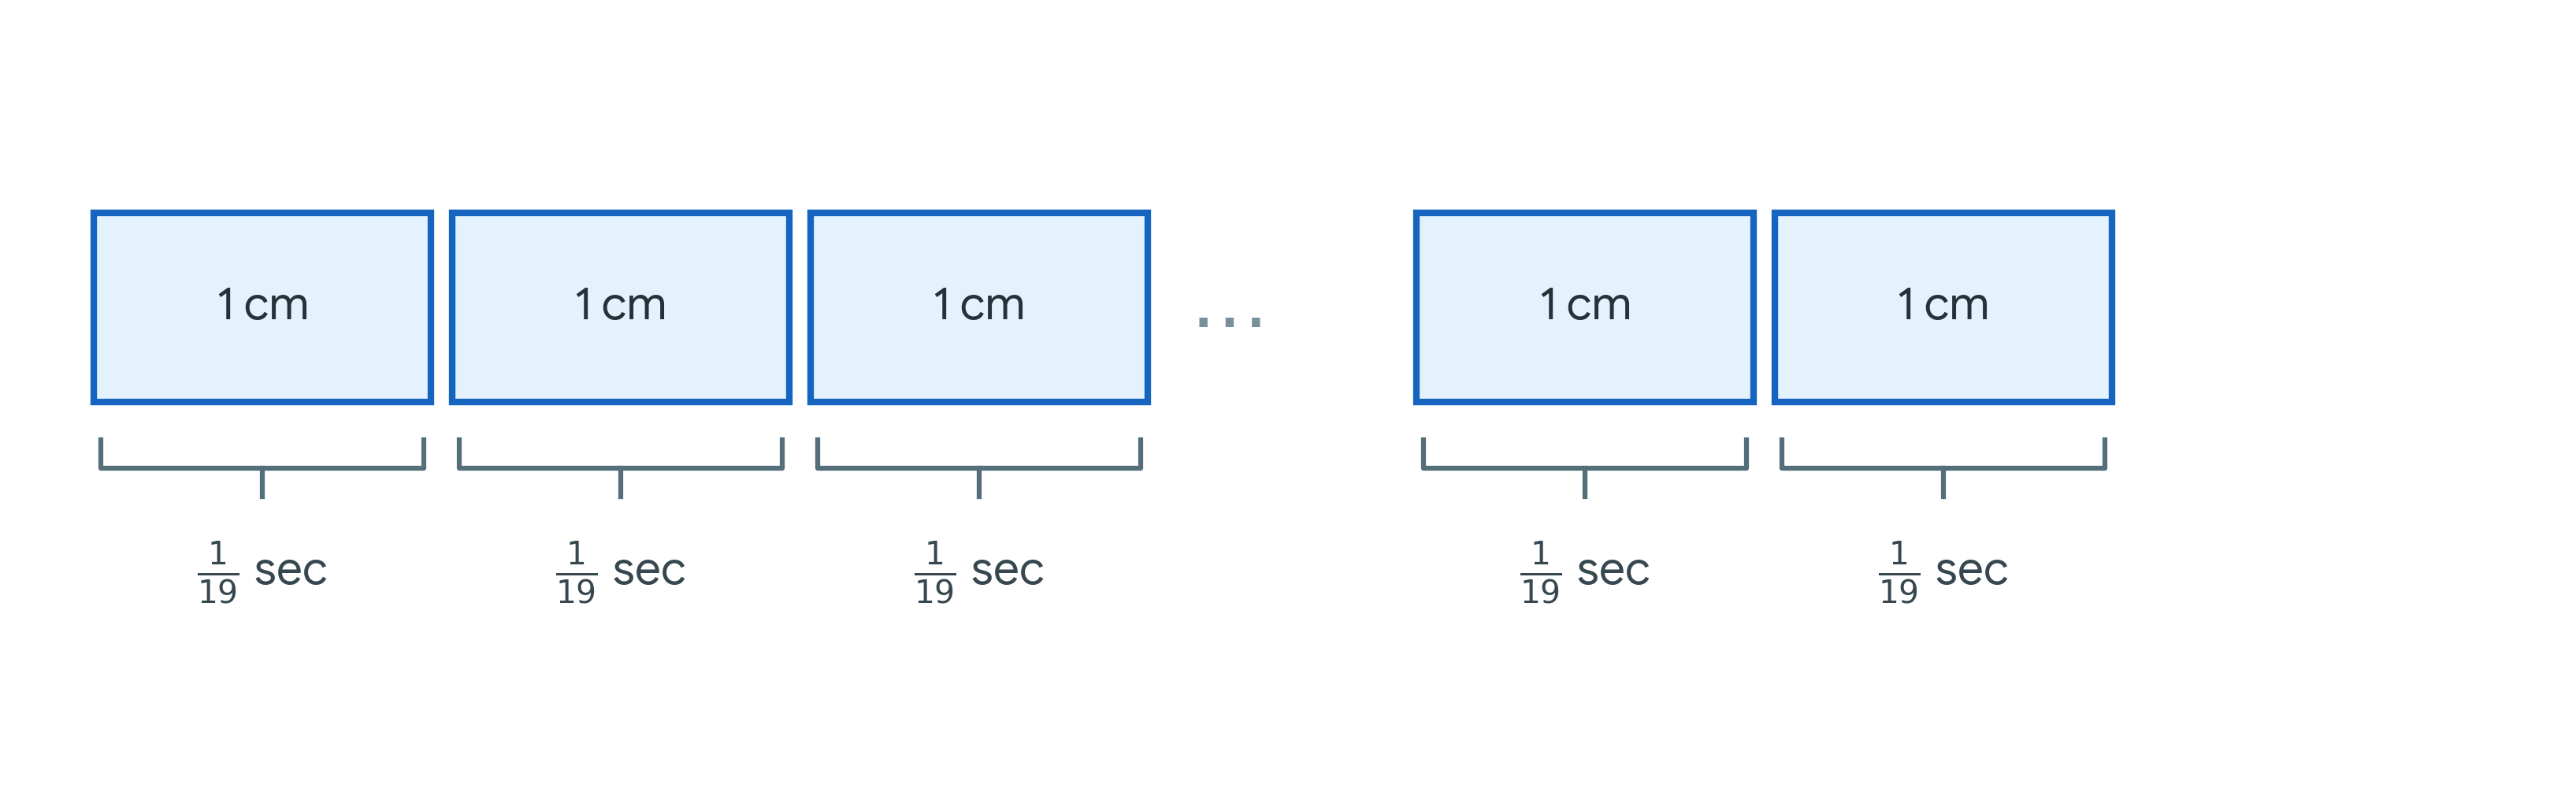
If we want to draw attention to the rate given in sec/cm, we could consider a diagram such as Figure 3.2.3. Here the total distance is chopped into distinct 1 cm blocks (much like that of each centimeter on a measuring tape) and the time is seen as \(\frac{1}{19}sec\) chunks corresponding to each cm labeled above. Here it would take \(\frac{1}{19} \cdot 76=4\) seconds. Again, this can be viewed as a scaled-up process of the single rectangle/bracket image taking a total of 76 such chunks so that a 4 second time setting on the Rover would correspond to a 76 cm distance stopping just 2 cm short of the 78 cm location of the deer.
Figure3.2.3.Visual Distance and Time Representation (sec/cm focus)
In either of these interpretations, the units attached to the numerical values help to provide insight into how the scaling process works. When we think about most of our experience with ratios and proportions in daily life, they almost always involve units and rates of change. It stands to reason that when teaching these concepts to students, we should also include these types of contexts so that our students have experiences to which they can relate the mathematical ideas. If we view mathematics as an abstraction of context-specific scenarios, we must first begin with the specifics so that abstraction can occur. Too often, mathematics classrooms start with definitions that assume the abstraction (i.e. no units are even considered). For example, in teaching rates of change, many texts start with the abstract definition of slope as \(m=\frac{\Delta y}{\Delta x}=\frac{y_2-y_1}{x_2-x_1}\text{.}\) This sterile presentation is missing the units that make the concept of rate meaningful.
Subsection3.2.2Proportional Reasoning and Ideal Gas Laws
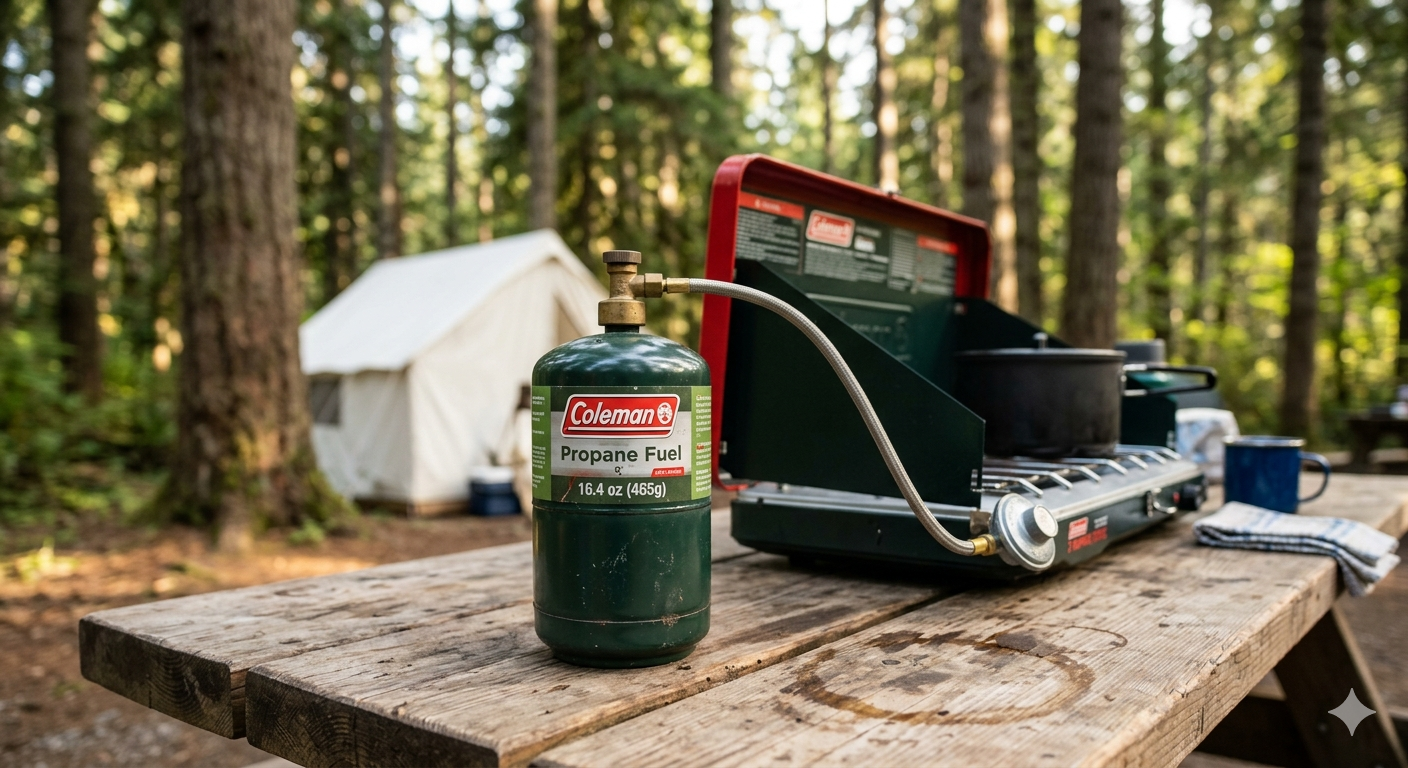
As winter approaches, you may have experienced the need to stop by your neighborhood gas station to add air to your tires. Or maybe you have noticed that on a beautiful Fall day while driving to observe the wonderful colors on the trees that your readings on the dashboard for tire pressure tick up ever so slightly. Or maybe, when camping, you noticed that when using your camping stove connected to a propane cylinder, there is significant condensation on the outside of the propane tank. You touch the tank only to realize that it is very cold. What is the cause of these observations?
Figure3.2.4.Propane Camping Cylinder
In the next activity, we will explore the nature of these observations and see the connections to the concepts of ratio and proportional reasoning. Bassok & Holyoak (1989) suggest, as teachers of mathematics, the culture of the mathematics classroom gives us an advantage since students seem to be more open to investigating, applying, and transferring isomorphic concepts across a variety of subject-matter domains. Therefore, we need to be versed in a myriad contexts where a mathematical abstraction can be seen within a real-world experience. The next activity will give use such an experience so that when we teach, we can make the mathematical relevent to students’ lives.
Activity3.2.1.Proportional Reasoning & Gas Laws.
Consider the way that pressure and temperature interact when the volume of the container holding the gas remains fixed. Earlier we discussed examples of tire pressure and propane tank temperature, but how can we quantify this relationship? Consider the experiment shown in Figure 3.2.5.
Figure3.2.5.Relationship Between Pressure & Temperature
(a)
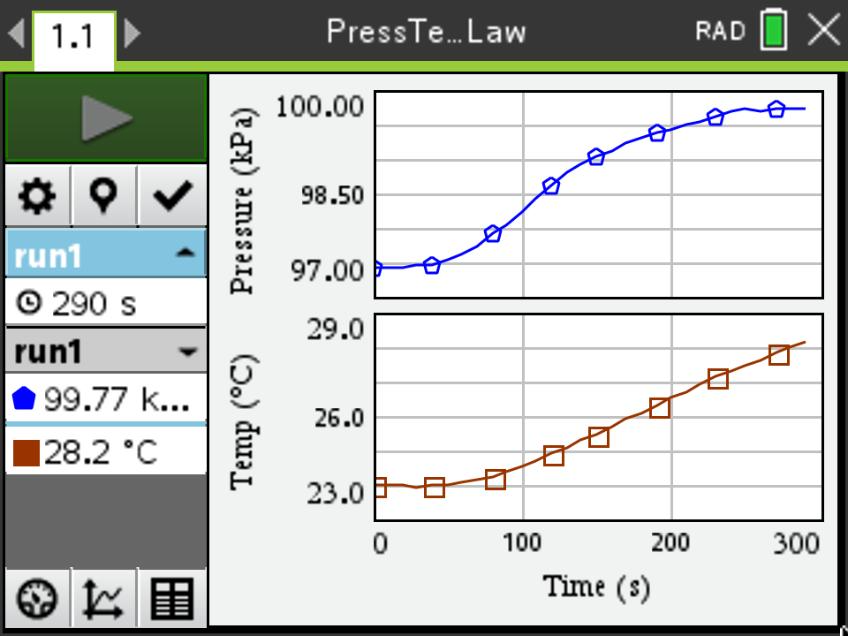
Using either the data you collected first-hand or the data provided by your instructor, describe how the graphs of the pressure and temperature verses time compare? You should see graphs simliar to the ones in Figure 3.2.6.
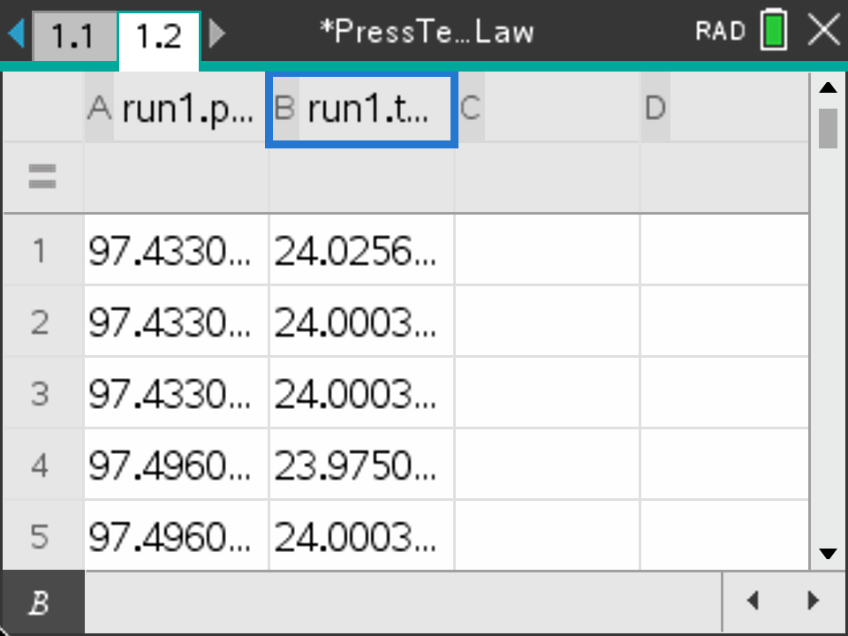
Figure3.2.6.Graphs and Data from Pressure and Temperature Experiment
(b)
In the 17th century, Guillaume Amontons, explored this relationship and noticed a rough ratio between pressure and temperature of gas in a fixed volume. He lacked the ability to accurately measure the temperatures, but none the less, he found that looking at ratios showed a pattern. Since here we will examine the same relationship and want to consider the ratio of pressure to temperature, we need to make sure we will not be dividing by zero. Therefore, we will use temperature data measured in degrees Kelvin, where \(0^{\circ} K\) represents the temperature where all molecular motion stops (\(-273.15^{\circ} C\)). To convert our data to \(^{\circ}K\text{,}\) we need to add 273.15 to our \(^{\circ}C\) data.
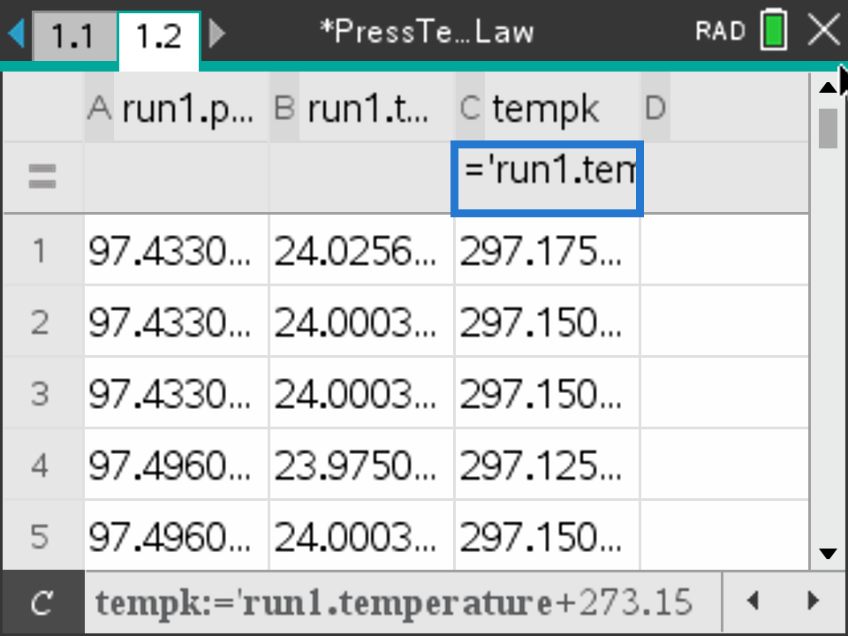
Begin by opening a spreadsheet and placing the pressure and temperature data in the first two columns (see Figure 3.2.6). You can do this by using the var key and selecting, \(\text{Link To}\text{.}\) Then, in the third column, give it a title like, tempk, for temperature in Kelvin. In the grey cell directly below the name press = and then, using the var key, select run1.temperature and add 273.15 to it (see Figure 3.2.7).
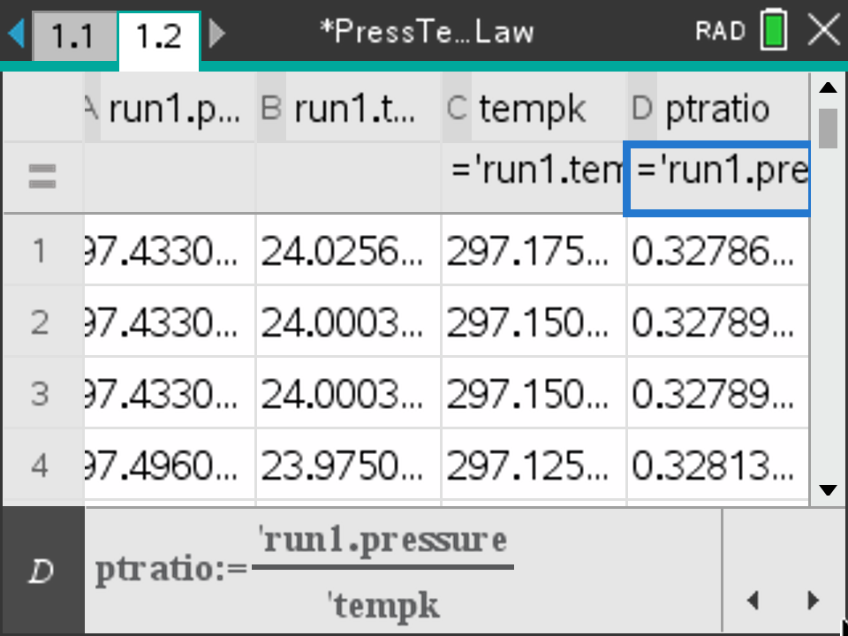
Figure3.2.7.Computing Kelvin Temperature & Ratio
To examine the ratio of pressure to temperature (in degrees Kelvin), repeat what you did in column 3, but give it a name like, ptratio, for the pressure-temperature ratio and compute the ratio in the grey cell below the name (see Figure 3.2.7).
Describe what you notice about the values of the ratios? Are they relatively consistent or do they fluctuate a great deal?
(c)
Using what you found in part (b), quantify (to two decimal places) the ratio of pressure (in kPa) to temperature (in \(^{\circ}K\)). What are the units for your ratio? Describe a physical interpretation of your units related to the change between pressure and temperature.
(d)
Based on the relationship you found, what pressure would you expect if the temperature of the gas in the flask were to reach \(40^{\circ}C\text{?}\)
(e)
If you have a gas in a fixed volume container with pressure and temperature of \(P_1\) and \(T_1\text{,}\) give an equation that would relate those pressure and temperature readings to another set of measurements, \(P_2\) and \(T_2\text{.}\)
While Guillaume Amontons lacked the ability to accurately measure temperature, his research did lead him to achieve an estimate of absolute zero of \(-240^{\circ}C\text{,}\) which wasn’t too shabby for the time. Later, Joseph-Louis Gay-Lussac was able to improve on Amontons’ work to state what is often referred to as the Gay-Lussac Law, \(\frac{P_1}{T_1}=\frac{P_2}{T_2}\text{.}\) This is a special case of the more general ideal gas relationship, \(\frac{P_1V_1}{T_1}=\frac{P_2V_2}{T_2}\) where the volumes cancel out if they are indeed the same.
While we can numerically examine the ratio of pressure to temperature to see that we roughly maintain the same value, we can also help students to see this relationship in more than one way. If we see the numerical value of the ratio stay the same, this implies that if one quantity changes, the other quantity must change in a similar manner. In looking at the graphs of both pressure and temperature versus time in Figure 3.2.6, we can notice that the overall "shape" of both graphs are the same. This visual representation conveys the relationship that as one changes, the other changes in a "similar" manner. Therefore their relative ratio should remain fairly constant. Having more than one representation to explain the consistent behavior of the quantities relative to each other gives the learner a means of confirming and deepening the understanding.
Activity3.2.2.Developing an Activity for Ratio and Proportion.
One of the challenges for teachers is coming up with ways to make the mathematics meaningful for their students. In this task, your job is to develop an activity for students that will ask probing questions that guide them to an understanding of proportional reasoning.
(a)
In your groups, search the internet for applied uses of ratio and proportion. Make a list of at least 5 different contexts in which you could expose students to these concepts and list them on your whiteboards for class discussion.
(b)
After the class discussion, discuss the pros and cons of each context you have chosen and narrow your list to one context that you can use to develop an activity.
(c)
Develop an ordered list of questions you might pose to students that would guide them to discovering the ratio or proportional relationship. Discuss why you placed the questions in the order that you did and be prepared to share your thoughts with the class.
(d)
Using your work from parts (a)-(c), create a written activity that could be used with students. Be sure to include space for student responses and provide any images you think the students would need to complete the activity.
Exercises3.2.3Exercises
1.
As we have seen in Activity 3.2.1, the ratio of pressure to temperature (in \(^\circ \text{K}\)) is constant for an ideal gas if the volume is fixed.
(a)
Suppose the tires on your car have a pressure of 38 psi (pounds per square inch) when it is 23.5\(^\circ \text{C}\text{.}\) In order to maintain even wear on your tires, you do not want to let the pressure drop below 35 psi. Assuming the volume of the tires remain constant, how cold does it need to get, in \(^\circ \text{C}\text{,}\) before you need to add air to your tires? For this calculation, first convert to kPa for pressure.
(b)
In Activity 3.2.1, we made certain that our measurements for temperature were in \(^\circ \text{K}\) and just happened to use kPa for pressure. In part (a), the pressure was given in psi instead of kPa and you were asked to first convert to kPa in solving the problem. Now compute the temperature from part (a), but this time leave the pressure in psi. Do you get the same temperature? Explain.
(c)
Suppose the conversion factor for going from psi to kPa is called, \(f\text{.}\) Show the proportion you used to find the temperature with \(f\) used for your conversion factor. What happens to \(f\) in your equation and what does this say about whether or not you need to have the pressure given in kPa?
2.
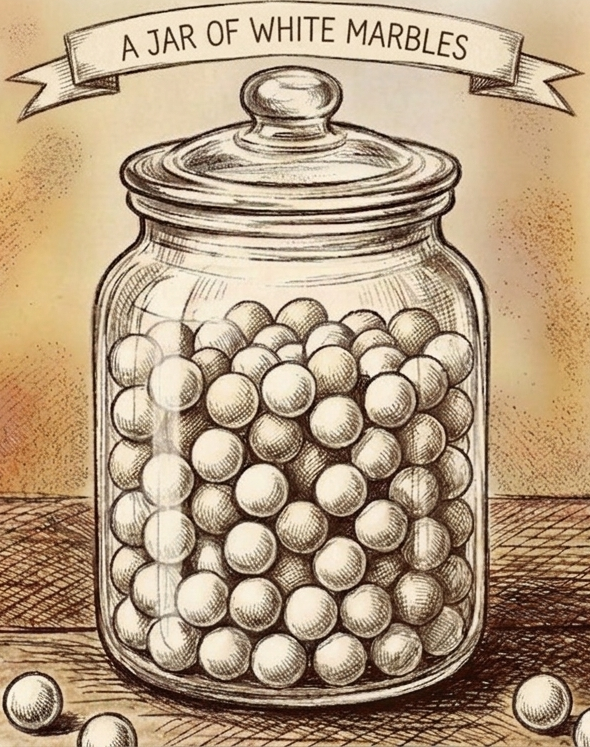
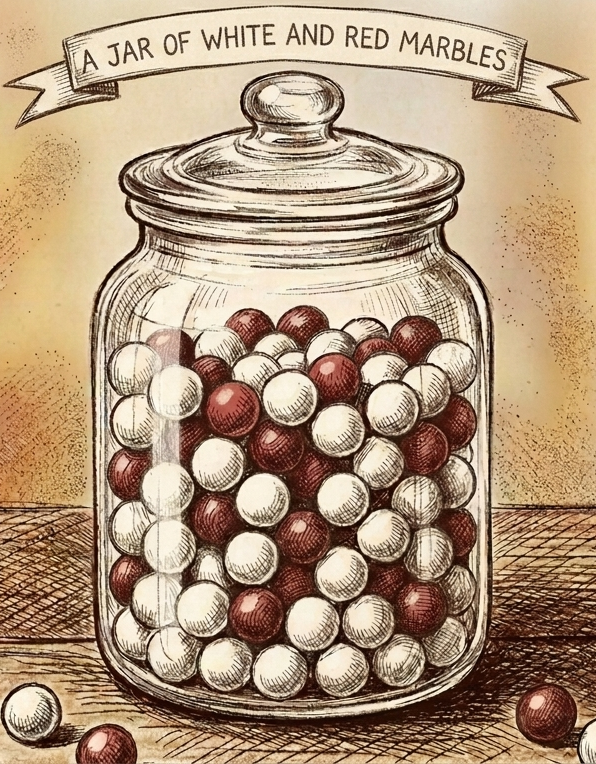
Suppose you have a jar filled with white marbles. You would like to have an estimate of how many white marbles are in the jar, but do not want to count them all. Instead you take 40 red marbles and place them in the jar along with the white marbles. You then shake the jar to mix the marbles and draw out 20 marbles, 2 of which are red and the others are white. Using this sampling technique, how many white marbles were originally in the jar?
3.
At \(21^\circ \text{ C}\text{,}\) a camping propane cylinder has a pressure of \(965\text{ kPa}\text{.}\) The cylinder can be safely stored as long as the pressure does not exceed \(1379 \text{ kPa}\text{.}\) In \(^\circ \text{C}\text{,}\) how high can the temperature be to store the cylinder?