When we think of proportional reasoning, one of the areas of mathematics where we can truly "see" it is geometry. The ancient Greeks used a very special proportion in their artwork as well as architecture, The Golden Ratio. This ratio seemed to be found in nature and was deemed pleasing to the eye. In fact, the Fibonacci sequence, \(\left\{1,1,2,3,5,8,13, \ldots \right\}\text{,}\) has the interesting characteristic that the successive ratios of adjacent terms, \(\frac{F_n}{F_{n-1}}\text{,}\) approach The Golden Ratio as \(n \rightarrow \infty\text{.}\) You may recall that the Golden Ratio occurs when the ratio of the larger of two values to the smaller, \(a\) and \(b\text{,}\) is equal to the ratio of the sum of the two values to the larger of the two values. In other words, when \(0 \lt a \lt b\text{,}\) we have \(\frac{a+b}{b}=\frac{b}{a}=\varphi =\frac{1+\sqrt{5}}{2}\) where \(\varphi\) is typically used to represent this ratio. Just like the Fibonacci sequence that is seen throughout nature, The Golden Ratio also seems to be present all around us.
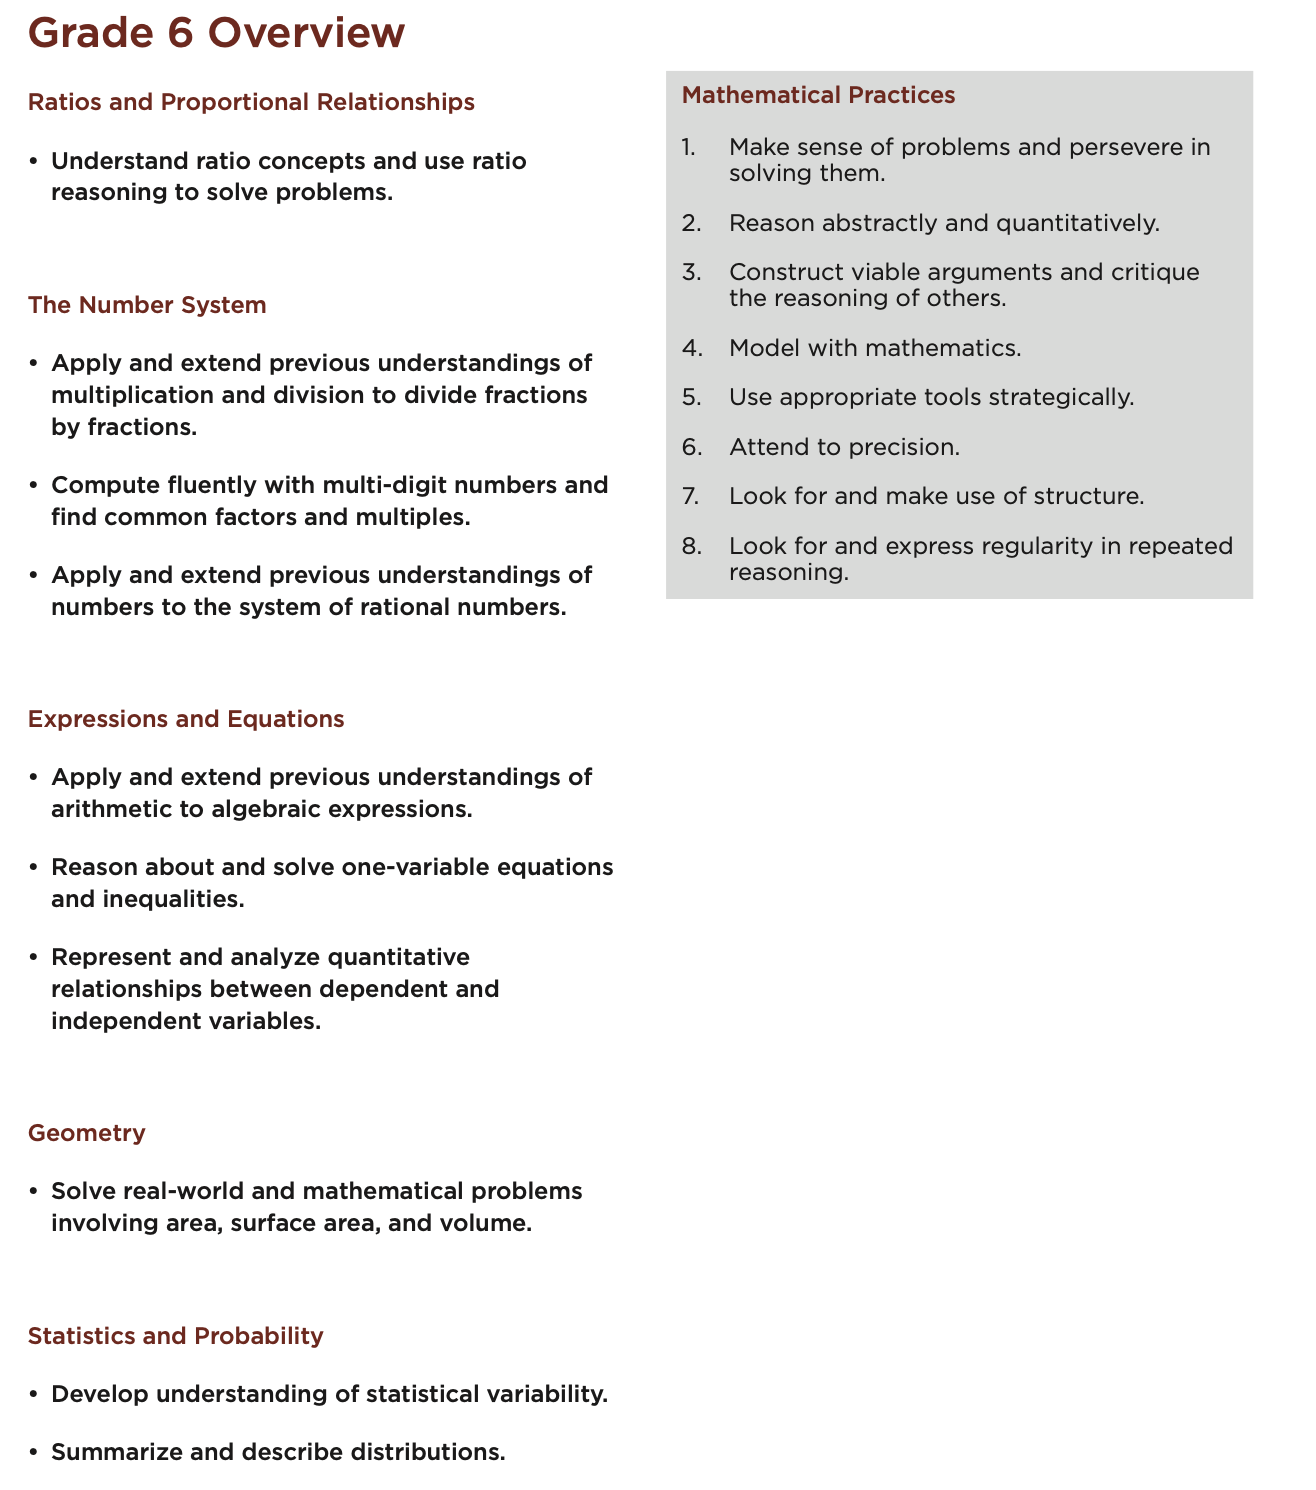
Since ratios seem to describe many patterns we see in the world, we should consider how the concept of ratio develops in students and try to identify an appropriate place in the curriculum to begin engaging our students with ideas related to ratio and proportion. When we examine the Common Core State Standards, the first place we see ratio finding its way into the curriculum is in Grade 6 (see Figure 3.1.1). While fractions are seen in Grade 3, the treatment of the concept of rational numbers as ratios has not yet reached the stage where ratio and proportion would be viewed as relational as we would see them within the context of scaled up or scaled down representations of relative amounts or unit rates.
Figure3.1.1.Overview of the Common Core State Standards for Grade 6
It is also important to note that while some ratios can be represented as rational numbers (hence the imbedded word ratio in the word rational), not all ratios are viewed in the same sense. For example, when I make my hummingbird liquid for my feeder, the ratio I use is 1:4 of sugar to water. It would not be the case that the concentration of sugar is \(\frac{1}{4}\) since I would use 1 cup of sugar and 4 cups of water. The ratio is referring to a part-part comparison, but the concept of concentration (or fraction) refers to a part-whole comparison. In this case, the whole portion of the comparison would refer to the total \(1+4=5\) and so the concentration would be \(\frac{1}{5}\) or \(0.2\text{.}\) Note that the decimal form expressing this fraction is often referred to as a decimal fraction. The word "fraction" typically refers to the part-whole comparison and sometimes is used interchangeably with the term "rational number". However, a rational number is, more simply, a number that can be expressed as one integer divided by another non-zero integer. So we can have ratios like 1:4 that would not fit the criteria of a fraction if we are referring to a part-part comparison.
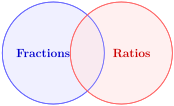
Similarly, we could have a fraction like \(\frac{1}{5}\) that would not fit the criteria of a ratio since in this interpretation, the "5" refers to the whole. However, we could also consider an interpretation where \(\frac{1}{4}\) could be viewed as both a 1:4 ratio and as a fraction. If we interpret this relationship as that there is \(\frac{1}{4}\) as much sugar as water, the number, \(\frac{1}{4}\text{,}\) could be viewed as a "fraction" of the amount of water used. Therefore, we can see Ratios and Fractions as having a Venn diagram as seen in Figure 3.1.2 where the \(\frac{1}{4}\) just described could appear in the intersection of the two sets.
Our earlier example of The Golden Ratio, is in fact, an irrational number, meaning it cannot be expressed as one integer divided by another integer. This is also an example of a ratio that would not be considered a fraction.
Figure3.1.2.Venn diagram comparing ratios and fractions
To explain the difference between ratio and fraction, let’s consider some examples to illustrate why, for example, "addition" behaves differently in the part-part comparison verses the part-whole comparison.
When working with fractional notation, it is easy to confuse the algebraic operations of fractions with the compounding properties of ratios. While they can look identical on paper, they describe fundamentally different relationships.
The Core Conceptual Difference.
A fraction represents a part-to-whole relationship. The denominator represents the entire pool or total unit quantity.
A ratio represents a part-to-part relationship. The two terms compare independent quantities or distinct subgroups to each other.
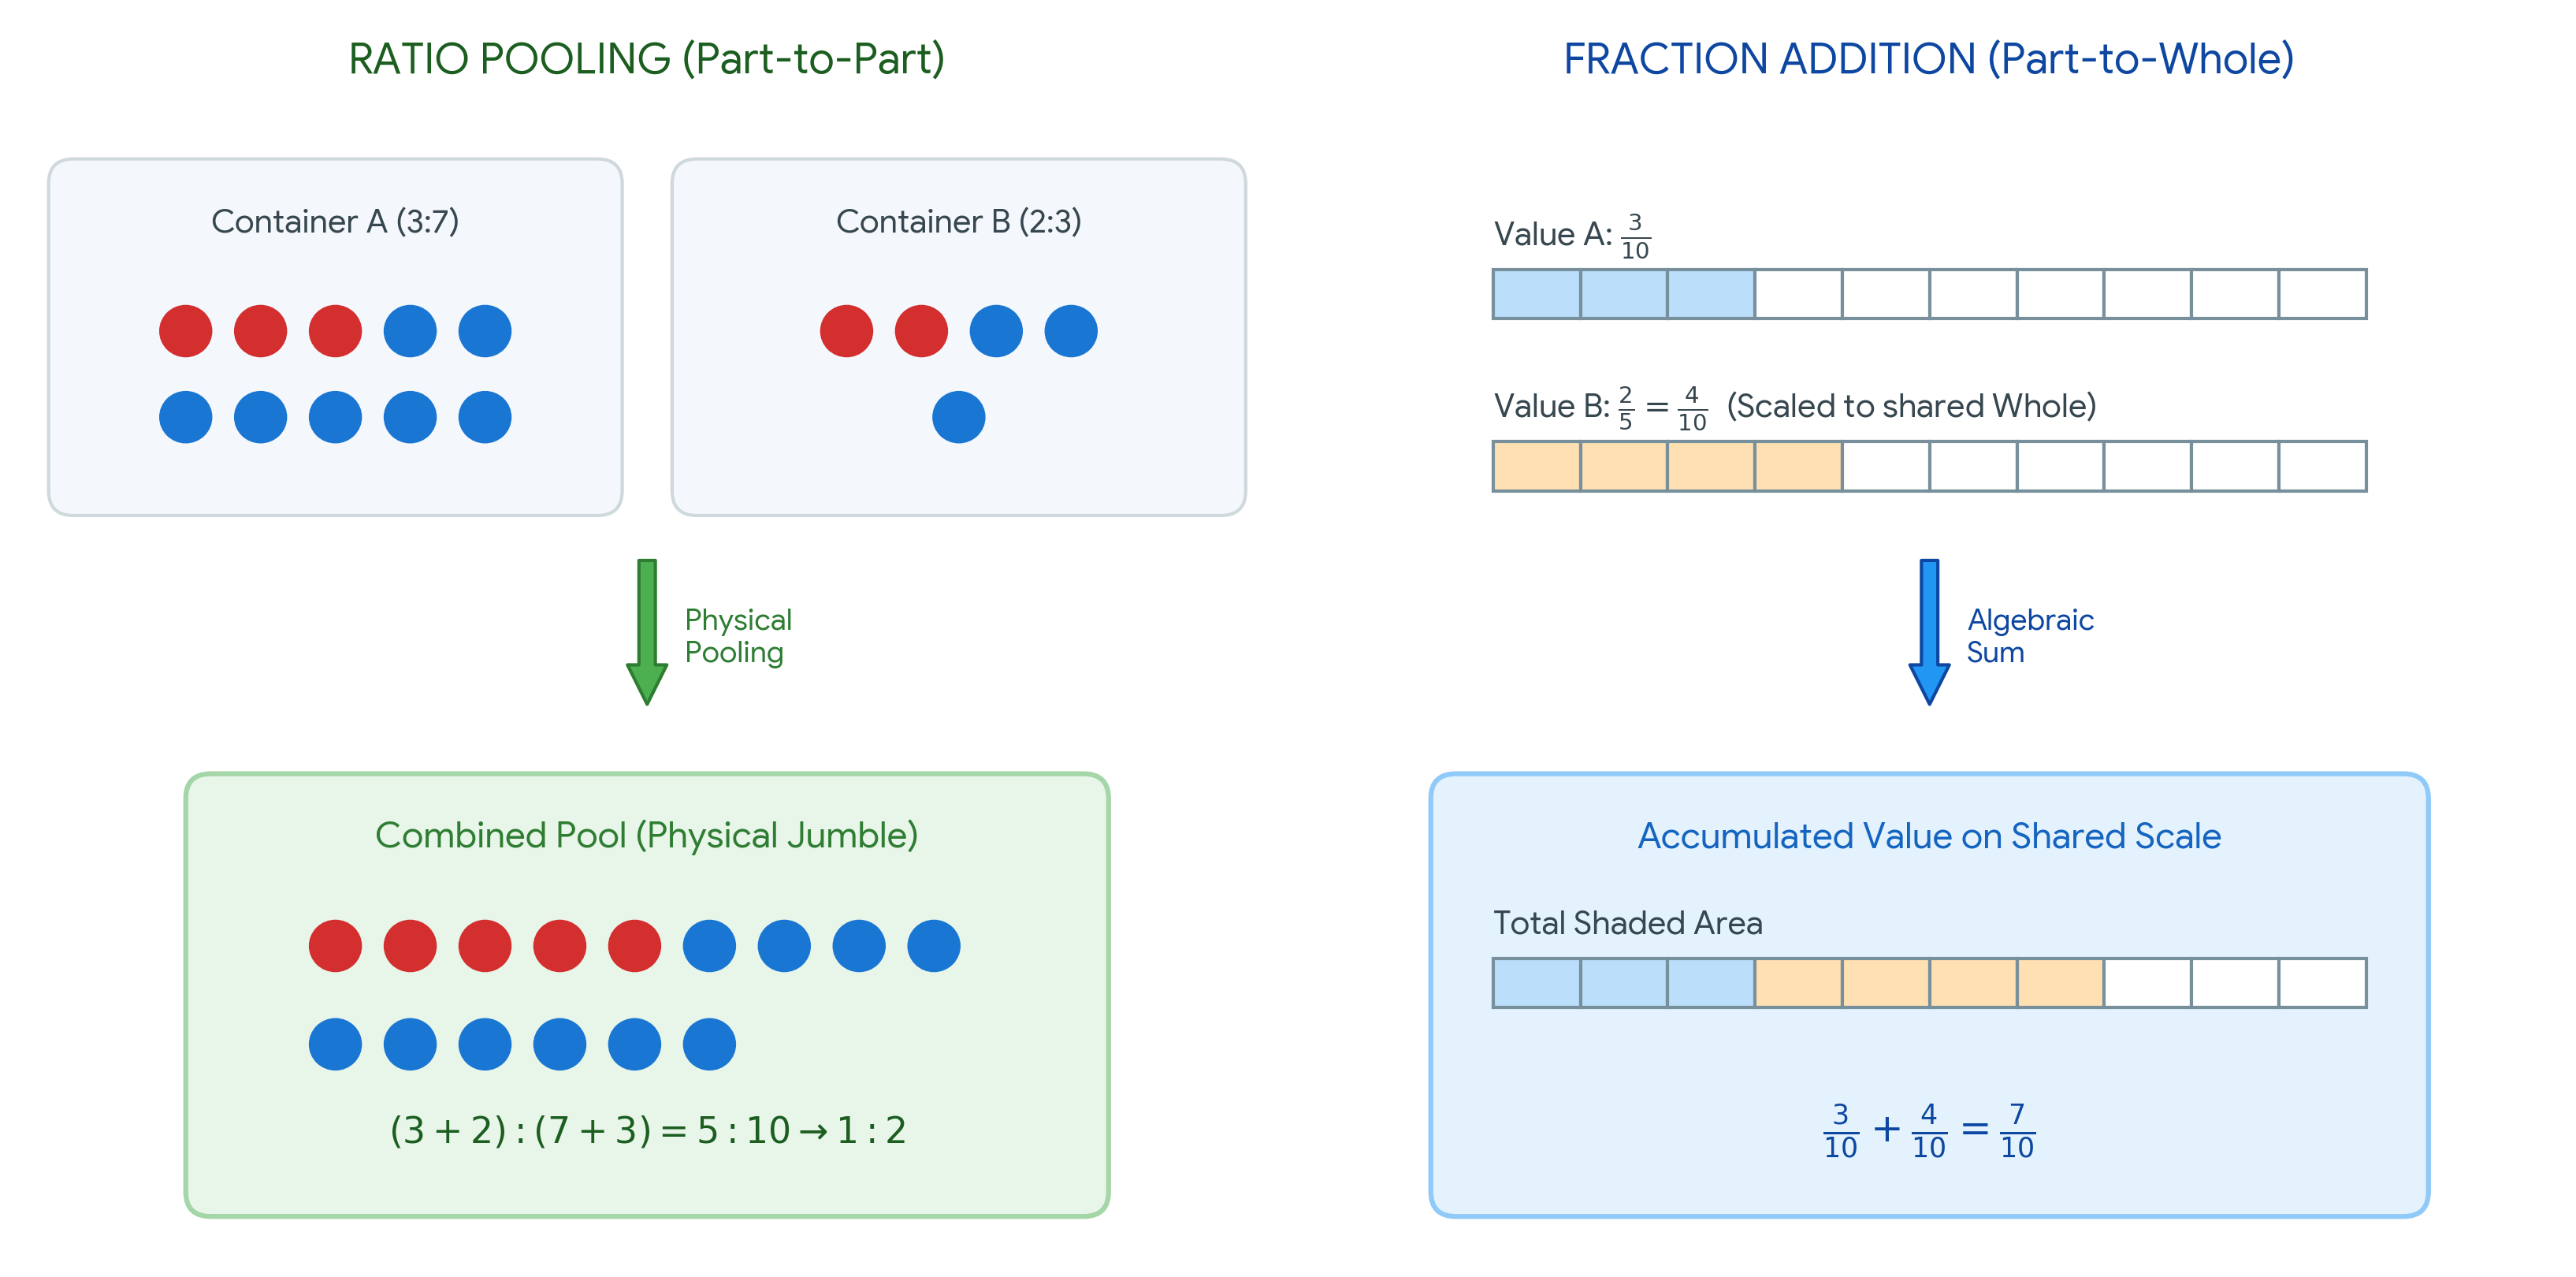
This conceptual distinction directly dictates the rules for combining quantities. When we mix or pool two sets of data together, we can add the individual components of a ratio straight across to find a new, accurate ratio. However, we cannot do this with fraction addition because fractions operate on a fixed mathematical scale. Consider the following example and its representation in Figure 3.1.3.
Figure3.1.3.Part-Part vs. Part-Whole Addition
Example3.1.4.Pooling Two Containers.
Suppose you have two separate buckets containing red and blue marbles:
Bucket A: Contains \(3\) red marbles and \(7\) blue marbles.
Bucket B: Contains \(2\) red marbles and \(3\) blue marbles.
Analyze what happens to the ratios and the fractions when Bucket A and Bucket B are dumped into a single large container.
Solution.
First, let us examine the physical counts of the final pooled container:
The Ratio Approach (Part-to-Part): In isolation, the red-to-blue ratio of Bucket A is \(3:7\) and Bucket B is \(2:3\text{.}\) Because ratios compare independent parts, combining the buckets means we simply add the respective components:
This simplifies perfectly to \(1:2\text{.}\) Component-wise addition yields an accurate new ratio for the combined set.
The Fraction Approach (Part-to-Whole): Now let us look at the fraction of red marbles in each bucket. In Bucket A, the fraction is \(\frac{3}{10}\text{.}\) In Bucket B, the fraction is \(\frac{2}{5}\text{.}\)
If we erroneously add the numerators and denominators straight across like we did with the ratio components, we get:
While \(\frac{5}{15}\) accurately describes the final physical state of the pooled container (5 red out of 15 total), it is a mathematical falsehood to call this addition.
Remark3.1.5.Algebraic Addition vs. Physical Pooling.
The algebraic addition symbol (\(+\)) demands a shared, fixed scale relative to a unit whole (a common denominator). Writing \(\frac{3}{10} + \frac{2}{5} = \frac{5}{15}\) claims that \(0.30 + 0.40 = 0.33\text{,}\) which is numerically impossible.
To truly add fractions as numerical values, you must convert them to share a common whole:
In summary: component-wise addition of ratios simulates the physical pooling of independent subsets. Algebraic addition of fractions calculates the net accumulated value of parts belonging to a shared unit scale.
Throughout this chapter, we will explore multiple ways that concepts of ratio and proportion can be viewed. The fact that there are so many lenses through which to see these ideas highlights how complex it is to teach the nuances among ratio, fraction, rational number, and proportion.
Subsection3.1.1Measuring Shadows: The Case of Cisco
Cisco is in his third year of teaching \(6^{th}\) grade mathematics. He is wanting to help his students develop a conceptual understanding of ratio and proportion beyond the procedural way he learned it. In his pre-service preparation, he remembered having fun indirectly measuring the height of a building on campus by using shadows on a sunny day and wants to try it with his students. He is concerned that if he simply tells them how to do it, the process will be perceived as a memorized algorithm and he will be back in the situation he grew up in where the understanding is lost on his students. He decided to first preface the activity with a dynamic geometry experience hoping the students might use what they discover to then suggest a method for measuring shadows as a way to indirectly measure the height of a pine tree in the school yard.
Activity3.1.1.Triangle within a Triangle.
Cisco : Today, I want us to explore what happens when we place a right triangle inside another right triangle. In this particular case we start with \(\triangle ABC\) and then create another triangle, \(\triangle ADE\text{,}\) by creating the segment \(\overline{DE} \parallel \overline{BC}\) as in Figure 3.1.6. What I want you to do is to play around with changing the triangles by moving points \(B\text{,}\)\(C\text{,}\) and \(D\) to see what you notice. After you have explored a bit, then answer the following questions to summarize your observations.
Figure3.1.6.Triangle in a Triangle
(a)
Since both triangles share a common angle, \(\angle CAB\text{,}\) and \(\overline{DE}\) and \(\overline{BC}\) are both perpendicular to \(\overline{AB}\text{,}\) what can you say about the angles in both triangles no matter how you change points \(B\text{,}\)\(C\text{,}\) and \(D\text{?}\)
(b)
How would you describe the "shapes" of the two triangles \(\triangle ABC\) and \(\triangle ADE\text{?}\)
(c)
To try and explain the nature of the "shape" of the triangles, imagine if you were to place a triangle on a copy machine and tell it to copy at 200%. If say side, \(\overline{BC}\text{,}\) of \(\triangle ABC\) measured to be 7 cm originally, how long would you expect its copied side, \(\overline{BC}\text{,}\) to be? Does this match with what you observed for the lengths when you manipulated points \(B\text{,}\)\(C\text{,}\) and \(D\text{?}\) Explain your thinking.
(d)
Now that you have used a thought experiment to consider how an enlarged copy of a triangle would behave, let’s consider the relative lengths inside both a small and large triangle with similar shapes. To the left in Figure 3.1.6, there are ratios of sides from both the small and large triangles. When you move around points \(B\text{,}\)\(C\text{,}\) and \(D\text{,}\) what do you notice about these ratios? Explain your thinking.
(e)
In Figure 3.1.6, move points \(B\text{,}\)\(C\text{,}\) and \(D\) until \(\overline{AB}=6\text{,}\)\(\overline{AD}=3\text{,}\) and \(\overline{BC}=3\text{.}\) Now think about our copy machine thought experiment. What percent copy would you need if you were wanting to copy \(\triangle ADE\) and make it to be the same size as \(\triangle ABC\text{?}\) What factor would you need to multiply side \(\overline{AD}\) by to get the length of \(\overline{AB}=6\text{?}\)
(f)
Will the same factor you used in part (e) work for converting the length of \(\overline{DE}\) to the length of \(\overline{BC}=3\text{?}\) Explain your thinking from your understanding of how a copy machine works.
(g)
If you use the same factor to multiply the length of \(\overline{DE}\) to get the length of \(\overline{BC}\) and to get the length of \(\overline{AB}\) from the length of \(\overline{AD}\text{,}\) what will happen to those factors when you divide \(\frac{\overline{BC}}{\overline{AB}}\text{?}\) How will their fractions compare? Does this match what you observed in Figure 3.1.6? Explain your thinking.
Now that Cisco has laid the groundwork for the real task he was wanting to pose, he approaches his students the next day in the following exchange.
Cisco : What I am wanting to do today is to try and find the height of the flagpole in front of the school. In your groups, try to think of some ways we could find this height. Summarize your ideas on your whiteboards and be read to share.
[Cisco gives the students 15 minutes to come up with some strategies and then brings the class back together.]
Cisco : OK, what have you come up with? Yeah, Group 4?
Nate : Well, we thought it might be easiest to just tie a piece of string onto the clips of the rope that’s already on the pole and then pull it up and then mark the string at the bottom. Then we lower the end of the string back down and measure the piece of string to the mark we made.
Cisco : What do you think of their idea?
Siera : That would be very easy to do. I think it will work.
Cisco : To get an idea of how this method might work, I took a picture of the flagpole this morning. Here it is. [Cisco displays the picture] If our goal is to find the height of the flagpole, can anyone see a problem with this approach? Take a couple of minutes to discuss it in your groups.
Cisco gives them 3 minutes to discuss and then brings the class back together]
Cisco : OK, does anyone see the problem I am concerned about? Yeah, Leah.
Leah : I think we see it. The rope attached to the pulley doesn’t go all the way to the top of the pole.
Cisco : Bingo! That was what I was thinking. Are their any work-arounds you can think of? Yeah, Cassie.
Cassie : What if we attached the string to a drone and flew it to the top of the pole? Then we could pull it tight and mark the bottom.
Cisco : That’s a great idea, Cassie. Does anyone have a drone? And more importantly, could you pilot it to land on top of the flagpole? Yeah, Ben.
Ben : I have a drone, but there is no way I could fly it to the top of the flagpole. I’m usually lucky to not lose it in the trees.
Cisco [laughs] : OK, so the drone is out. Let’s think of another way. There is a reason I am posing this task today right after our exploration from yesterday. Let’s take a few minutes to review what we did yesterday and put it in the perspective of today’s task. In your groups, discuss what we did yesterday and try to think of how we might use it for measuring the height of the flagpole.
[Cisco gives the groups 15 minutes to discuss the exploration from the previous day and the current task at hand and then brings the class back together]
Cisco : Any ideas? Yeah, Group 2?
Jules : We thought we could make a scale model keeping the angles the same like in the GeoGebra sketch. Yesterday, we had two triangles that were the same shape since all of the angle were the same and so we just need to find the factor we need to scale it up to the size of the flagpole. We just weren’t sure how to figure the angles to keep them the same.
Cisco : A scale model? That’s a great idea. We can assume the flagpole is perpendicular to the parking lot, so that will give us one angle. I like your idea of finding the scale factor to take the model and scale it up to the flagpole size. In the GeoGebra sketch, remember that the ratios on the left were always the same. Maybe we could use the small model to figure the ratio and then we would need just one side of the the other two sides of the big "flagpole" triangle to find the flagpole length. Yeah, Nori?
Nori : But if we can’t stretch a string from the top of the flagpole, how can we get the hypotenuse to have one other side of the big triangle?
Cisco : Good point. Maybe that means we need to rely on the other side? You know, like the one that would be along the ground? That would mean we need to get the angle at the top or the angle with the ground to be the same in both the model and the actual flagpole triangle. Any ideas? Yeah, Leah.
Leah : In history, we talked about how early the Greeks did things in math thousands of years ago. We read that some of the things they did used shadows to make models. Could we do something like that?
[Cisco had been waiting for this opportunity, so he decided to prompt a little to get them going in the direction he wanted them to go.]
Cisco : Can I make a suggestion? [class indicates a positive response] What if we use a sunny day and take something like a meter stick out to the parking lot. As long as we make sure to hold the meter stick perpendicular to the parking lot, say with a protractor, we could use the shadows of the meter stick and flagpole measured at the same time as the horizontal lengths in our two triangles. Since the meter stick is acting like the flagpole and the shadows are acting as the horizontal sides, we can find the scale factor using the meter stick and its shadow and then use the same factor with the flagpole’s shadow to find the length of the flagpole. Does this make sense? [class nods in approval]
Diyonn : But how do we know the two triangles have all the same angles? We only made use on of them was. You know, the right angle at the bottom.
Cisco : Good point, Diyonn. Anyone have a thought about this? Nate?
Nate : I think we can because the sun is shining at the same angle on both the stick and the flagpole as long as we measure at the same time. So the angle you would look at if you were trying to stare at the sun from the ground on both would be the same. Because the other angle is a right angle on both, that means the third angles would also have to be the same since it would just be \(90^{\circ}\) minus the angle at the bottom that are the same in both.
Cisco : Is everyone convinced? [class nods in agreement] Ok, let’s do this. Fortunately, it’s a sunny day out today. Well, partly sunny, so we will need to plan the make sure to be ready to measure in between any cloud that may come up. Each group have your materials manager get a meter stick from the cabinet along with a protractor and measuring tape. Then line up to go outside.
Activity3.1.2.Shadow Worlds.
Now that we have seen the discussion play out in Cisco’s class, let’s do the indirect measurement activity that his students would have completed. Your instructor will choose an object that would be difficult to directly measure and a sunny day to do this investigation. Like Cisco’s class, you will need a meter stick, protractor or angle ruler, and a measuring tape or string that can be measured later.
(a)
Place the meter stick perpendicular to the ground and have someone in your group hold it in place. Make sure you can clearly see its shadow when the sun is shining. Your instructor will pick a person to mark on the ground the end of the shadow for object you are trying to measure when given the signal.
(b)
When given the signal, measure and record the length of the shadow of your group’s meter stick.
(c)
Compute the ratio of the length of the meter stick (1 meter) to the length of your shadow and record your result.
(d)
To find the height of the object of interest, we can use the same ratio, call it \(r\text{,}\) that you found in part (c). If the shadow of the object had length, \(s\text{,}\) and the object has height, \(h\text{,}\) then \(r=\frac{h}{s}\) and so \(h=r\cdot s\text{.}\) Compute your group’s estimate for the height of the object.
In Activity 3.1.2, the idea was to keep the ratio of sides the same in both the large and small triangles. When we want to solve for a side in one of the two triangles, we force this equality by creating a proportion. A proportion is just a relationship of equality between ratios. In the case of the height-shadow relationship, we force an equality by requiring that \(\frac{h_1}{s_1}=\frac{h_2}{s_2}\text{.}\) Now if we know any three of these values (for example, height and shadow of the meter stick triangle along with the shadow of the flagpole), we can find the remaining value in the proportion (in this case, the height of the flagpole).
Subsection3.1.2Angles and Cisco’s Extension
Cisco was so pleased with how his students reasoned about the angles and shadows to solve a real-world problem, he wanted to see how far he could extend their understanding to functional relationships between angles and ratios for right triangles. He knew that trigonometry was still a ways off in the curricular trajectory, but he felt that since they had solid reasoning about the angle relationships in figuring out the height of the flagpole, he would reach back to his GeoGebra sketch (Figure 3.1.6) and see if they could understand the functional relationship between an angle and the ratio of sides in a right triangle. We pick up his class discussion the next day after they had approximated the height of the flagpole.
Cisco : OK. Yesterday we were very lucky that the sun was shining so we could measure both shadows. But what if the sun was not shining? Would there be a way to still indirectly measure the height of the flagpole? I got to thinking about something last night. Yesterday, Jules had an interesting idea she shared about wanting to make a scale model, but her group was having trouble figuring how to deal with the angles. We avoided her problem by not measuring angles at all, but instead arguing that the angle for the shadow triangles would need to be the same and so we could just use the meter stick triangle to get the ratio we needed to scale up to the flagpole triangle. But what if we had the angle that the sun made with the shadow on the ground? Would that be enough? Today I am going to have you explore this a bit. In your groups, I want you to answer the following questions using the GeoGebra sketch (Figure 3.1.6) we used before.
Activity3.1.3.Angles and Ratios.
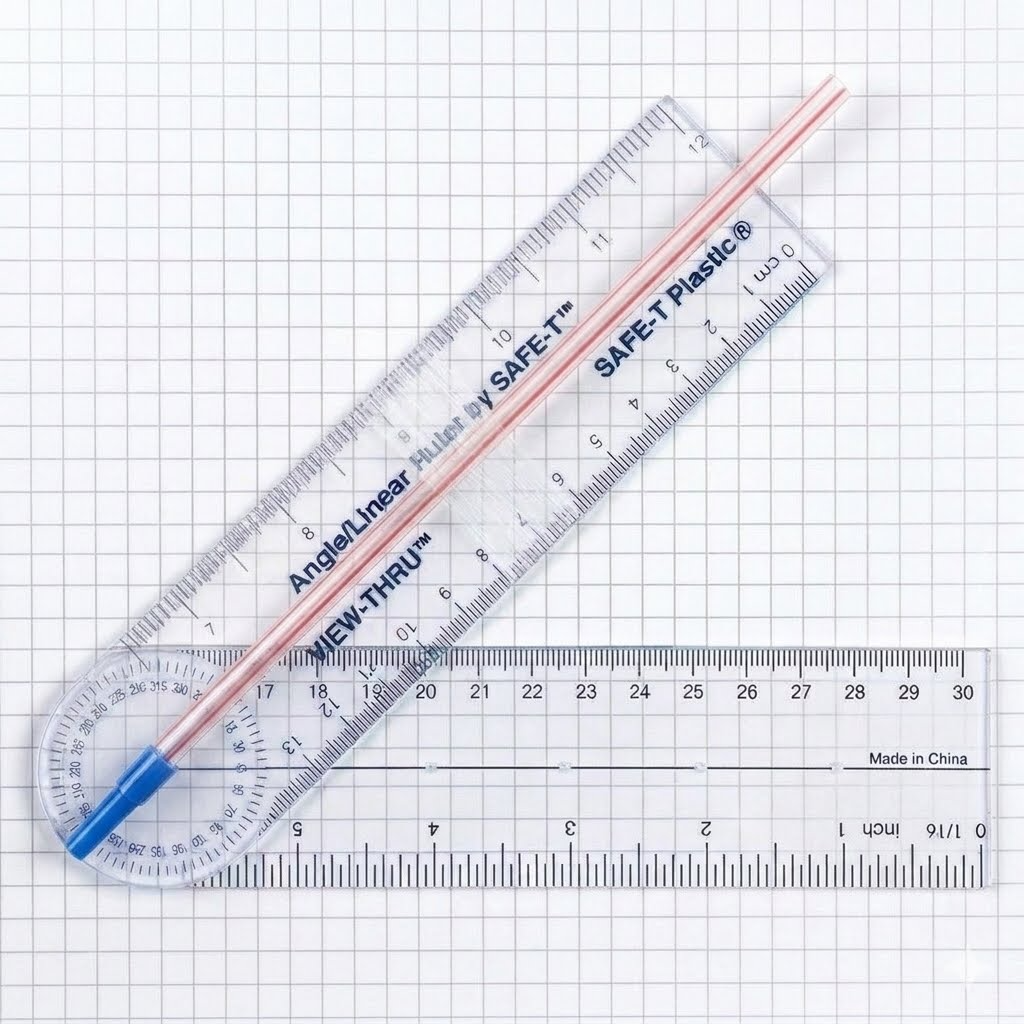
One way we can measure angles is using an angle ruler along with a straw attached to it (see Figure 3.1.7). Using this simple device, we can look through the straw at the top of the object whose height we want to measure and read the angle on the angle ruler.
Figure3.1.7.Angle Ruler with Straw
Now if we can somehow find a relationship between the angle and the ratio of sides, we can side-step the need to measure the shadow of the smaller triangle we used in the shadow experiment to find the ratio. Let’s explore this relationship.
(a)
Using the GeoGebra sketch (Figure 3.1.6), drag point \(D\) to make varying sized triagles. Describe what you notice about the ratio \(\frac{DE}{AD}\) for a fixed angle \(\angle{EAD}\) no matter how large or small the triangle is?
(b)
Now drag point \(C\) to change the angle and repeat what you did in part (a). Describe what you notice about the ratio when the angle measure is fixed to its new value.
(c)
Adjust the location of point \(C\) to create \(\angle{EAD}\) with the measures in the following table and record the corresponding ratios that go with each angle.
Angle, \(\theta\)
\(10^\circ\)
\(20^\circ\)
\(30^\circ\)
\(40^\circ\)
\(50^\circ\)
\(60^\circ\)
\(70^\circ\)
Ratio
\(\)
\(\)
\(\)
\(\)
\(\)
\(\)
\(\)
(d)
Create a scatterplot of the ratios as a function of the angle and sketch your results. Do you see a pattern in the data? Explain. What happens to the ratio value as the angle gets closer to \(90^{\circ}\text{?}\) What happens to the ratio value as the angle gets closer to \(0^{\circ}\text{?}\)
[Cisco brings the class back together for a discussion of their observations]
Cisco : OK, now that you have looked at what happens when you fix and angle and adjust the size of the triangle, can anyone tell me what you see in terms of the ratio? Yeah, Nate.
Nate : Well, we saw that if you keep the angle at the bottom the same, it doesn’t matter how big or small the triangle is, the ratio of the two sides is always the same. It’s kind of the same as we saw in the activity we did yesterday.
Cisco : So what I’m hearing is that if we know the angle, we should be able to know the ratio? Is that a fair summary of what you are saying?
Nate : Yeah, I guess. We hadn’t really thought about it that way, but yeah. That would work. That’s kind of the same thing. But if we didn’t measure the things in the sketch, how would we know the ratio for an angle?
Cisco : That’s a great question, Nate. Now when you get to high school, you will study this in greater depth, but for now, just know that when it comes to right triangles like these, we give names to the ratios of different combinations of sides for a given angle. In this case, we call the ratio of the "opposite" to "adjacent" sides the "tangent" of the angle. [Cisco draws a right triangle on the board and labels the sides and angle]. Can you see why we call this side [pointing to the opposite side] the "opposite" and this side [pointing to the adjacent side] the "adjacent" side? [class responds postively. Yeah, Leah?
Leah : But, like Nate said, how do we know the ratio if we have the angle?
Cisco : Well, every scientific calculator has these ratios built in. Take out your calculators. [students take out their calculators]. See that trig button? Press it. Now you will see other options you can select. Select the tan button and put in \(\tan \left(23^{\circ}\right)\) and press enter. What do you get?
Ben : I got like 0.42447.
Cisco : Do you notice anything about that number?
Siera : It’s like between what we had for \(20^{\circ}\) and \(30^{\circ}\) we had in our tables.
Cisco : Good observation. Now take your table from before and use the tangent command to fill it in with what you get from the calculator.
Angle, \(\theta\)
\(10^\circ\)
\(20^\circ\)
\(30^\circ\)
\(40^\circ\)
\(50^\circ\)
\(60^\circ\)
\(70^\circ\)
\(\tan \left(\theta\right)\)
\(\)
\(\)
\(\)
\(\)
\(\)
\(\)
\(\)
[groups take a few minutes and fill in the table]
Cisco : What do you see?
Patrick : They are the same as what we had before.
Cisco : So the table you made before by using the measurements was really just the tangent function. Now let’s use the tangent feature of your calculator to find the height of the flagpole. Grab the tape measure, angle ruler, and a straw and let’s go outside.
[Class grabs materials and heads out to the flagpole.]
Activity3.1.4.The Flagpole Revisited.
Using what we know about the tangent function, we only need to measure a distance from the base of the flagpole and the angle of elevation to find the height of the flagpole.
(a)
Pick a point a fair distance away from the flagpole and measure the distance. Record your distance.
(b)
Have one of your group members tape the straw along the line on the upper side of the angle ruler as shown in Figure 3.1.7. Then have your group member lay on the ground and look through the straw until you see the top of the flagpole through the straw. Be certain to keep the other side of the angle ruler horizontal to the ground. Record the angle you get between the ground and the line of sight to the top of the flagpole.
(c)
Since we know that \(\tan \left(\theta\right)=\frac{o}{a}\) where \(o\) is the opposite side of the triangle and \(a\) is the adjacent side, we can find the opposite side (in this case the height of the flagpole), by rearranging this to \(o=a \cdot \tan \left(\theta\right)\text{.}\) Use your measurements for the distance from the base of the flagpole and the angle of elevation to approximate the height of the flagpole. How does your result compare with what you got when you computed it using shadows? Explain.
One of the aspects of ratio and proportional reasoning is the idea that regardless of the way a fraction is expressed, going from one form to another involves a scaling up or down by multiplying both the numerator and denominator by the same value. In a sense, it is the same as multiplying the fraction by a nonzero number divided by itself (i.e. multiplying the fraction by 1). As you will recall from Section 2.1, we saw the elusive \(\frac{2}{3}\text{,}\) escape time and time again by simply changing forms in the cartoon, The Weird Number, found in Figure 2.1.19.
The scaling process found in Cisco’s class discussion reinforces the fraction concepts from earlier grades and applies them to a real-world problem where the idea of a scale model allows a visualization of the scale-up and scale-down process for fractions to take on a physical embodiment. In Section 3.2, we will continue this development with the concept of unit rates as a lens through which to view ratio and proportion.
Exercises3.1.3Exercises
1.
A glide ratio is the ratio of units of forward distance traveled for every drop in units of vertical distance. For example, a glide ratio of 15:2 meters means that for every drop of 2 meters, the aircraft would glide forward 15 meters. We typically see this ratio given so that the drop value is 1, so a 15:2 ratio would be expressed at 7.5:1.
(a)
Suppose a model glider has a glide ratio of 8:1. If a person releases the glider horizontally from the top of a 12 meter building, what is the scale factor you must use to express this ratio in the form \(\text{________}:12\text{?}\) What is the resulting horizontal distance the glider will travel before landing on the ground?
(b)
Suppose Chad and Erin each design a glider at the Maker Space. Chad’s glider has a glide ratio of 11.2:1 and Erin’s has a glide ratio of 9.1:1. To help even the contest, Chad is going to release his glider horizontally from the third floor window of the school (10.8 meters high) and Erin will release hers horizontally from the second floor window (7.2 meters high) directly below Chad. Assuming they each provide the same initial force for their respective glide ratios, whose glider will land farther from the school building?
(c)
Using the glide ratios as "slopes" and the initial heights of the windows as the "\(y\)-intercepts", create two linear functions that show the path of the gliders using \(y=0\) as the ground level. Do the \(x\)-intercepts match your predicted distances traveled from part (b)? Sketch your graphs on the same axes and explain.
2.
One application of ratio and proportion is in the estimation of animal populations. Suppose you want to estimate the deer population in a national park. Park Rangers can spot deer and tranquilize them and then place a visible tag on the deer. The deer are then released once they are revived. The rangers then recapture deer and record the ratio of tagged deer they see to the number of non-tagged deer. The assumption is that as the tagged deer mix among the rest of the population, their ratio of tagged to non-tagged with be the same. Since the rangers know how many they initially tagged, they can use proportional reasoning to esitmate the total number of deer in the population. This process is called capture-tag-recapture.
(a)
Suppose rangers in a park capture and tag 30 deer and then release them back into the forest. After the deer have had sufficient time to mix, the ranger capture a sample of deer and note that of the 40 they capture, 8 of them are tagged. Use this information to estimate the total number of deer in the park.
(b)
Park rangers know that the food supply in the park can only support roughly 500 deer before the scarcity of food poses a health risk to the population. Once the population reaches 500, they have a policy of bringing in hunters to "thin the herd". If the rangers have tagged 25 deer and released them, how many tagged deer do they need to find in a recapture process of 40 deer to justify bringing in hunters to thin the herd?
3.
Gwen has been teaching a lesson on ratio and proportion to her 7th grade class. She brings out a large glass fish bowl filled with small white marbles. She then hands each group 20 red marbles and asks them to estimate the number of white marbles originally in the bowl.
(a)
Describe a process by which the groups might provide an accurate estimate of the number of white marbles by using the red marbles.
(b)
Suppose Gwen knows there are 554 white marbles originally in the bowl. Describe how the process you proposed in part (a) would play out if the groups enacted it.
4.
In baseball, a player’s batting average is the ratio of the number of hits to the number of "at-bats". For example, if a player has, thus far this season, had 56 hits after 164 at-bats, the ratio would be \(56:164\text{.}\) In terms of batting average, this would be \(\frac{56}{164}\approx 0.341\text{.}\) We would then say that the player is "batting 341".
(a)
Suppose the player above bats "3 for 4" in the next game (i.e. 3 hits in 4 at-bats). Why does his new batting average become \(56+3:164+4=59:168\) or \(\frac{59}{168}\approx 0.351\text{,}\) but \(\frac{56}{164}+\frac{3}{4} \neq 0.351\text{?}\) Explain how you might address this confusion with a student in your class.
(b)
Recall back in Section 2.1, we watched the The Weird Number (see Figure 2.1.19). Explain how could you explain the batting average arithmetic issue using cakes as was done in the video?